.svg)


Is leaflet as good as precision agriculture?
Leaflet's Precision Accuracy: A Detailed Look at the Experiment
We recently ran a few experiments to validate leaflet’s technology and found the accuracy of leaflet’s soil moisture to be as good as precision agriculture. Standard sensors on the market are ± 15% accuracy, while expensive AgTech sensors are ±5%–Leaflet is ±5%. The lower the percentage, the more accurate the reading–but what does all this really mean for you?
Look to the soil: A Complicated Ecosystem
There’s a lot of potential problems brewing beneath the surface. For example, water is not equal–water in one city is different from the water in another. There’s chlorine, fluoride–all additives that impact your plants. Most of the time we don’t think about it. We just think water is water, but those are the little variables that start adding up. For those of you who enjoy growing edible plants, we’re also finding out micronutrients are heavily involved with their nutritional value. There are seven essential plant micronutrients: boron (B), zinc (Zn), manganese (Mn), iron (Fe), copper (Cu), molybdenum (Mo), and chlorine (Cl). These micronutrients are not only essential for plant development, but they’re what give you the flora in your gut. So what does this all mean for off the shelf sensors?
Why Precision is Important
Maybe you’ve tried an off the shelf sensor before, and been let down. That’s because with ±15% accuracy, the readings you’re getting on your plants will vary from day to day. While Agriculture Grade sensors are better than off the shelf/standard sensors, they’re generally prohibitively expensive. Who can afford thousands of dollars for one plant? And what about those of us who have hundreds of plants? That's why we set out to make leaflet as good as precise and accurate as Agriculture, but affordable. Check out our experiment below.
The Experiment
Objectives
1. To determine the linearity and precision of the leaflet soil moisture sensor. - The linearity will be determined by the Pearson Correlation Coefficient. - The precision will be determined by the confidence interval of the linear regression fit.
2. To compare these metrics to a standard-grade moisture sensor (Chirp!, wemakethings) and two agriculture-grade soil moisture sensors (EC-5 and the TEROS 12, METER Group)
Methods
1. Prepare soil moisture standards.
- Dry potting soil for approximately 24 hours in oven at 220 Fahrenheit
- Prepare at least 2 cups of each moisture standard at around the following water volume contents:
- 0%
- 10%
- 20%
- 30%
To calculate the moisture content, divide the total volume of the water added to the total volume of the soil in an uncompressed state. The small containers will be used to storage and measurements.
1. Record at least 5 measurements for each sensor, moving from the lowest to the highest standard. Place the probe in different positions at each reading. Before moving to another sensor, "fluff" up the soil moisture standards in a larger container by gently turning over several times to eliminate the influence of soil compaction.
2. For another measurement of precision, collect 21 readings for each sensor in the 20% standard.
Data Analysis
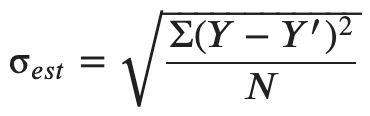
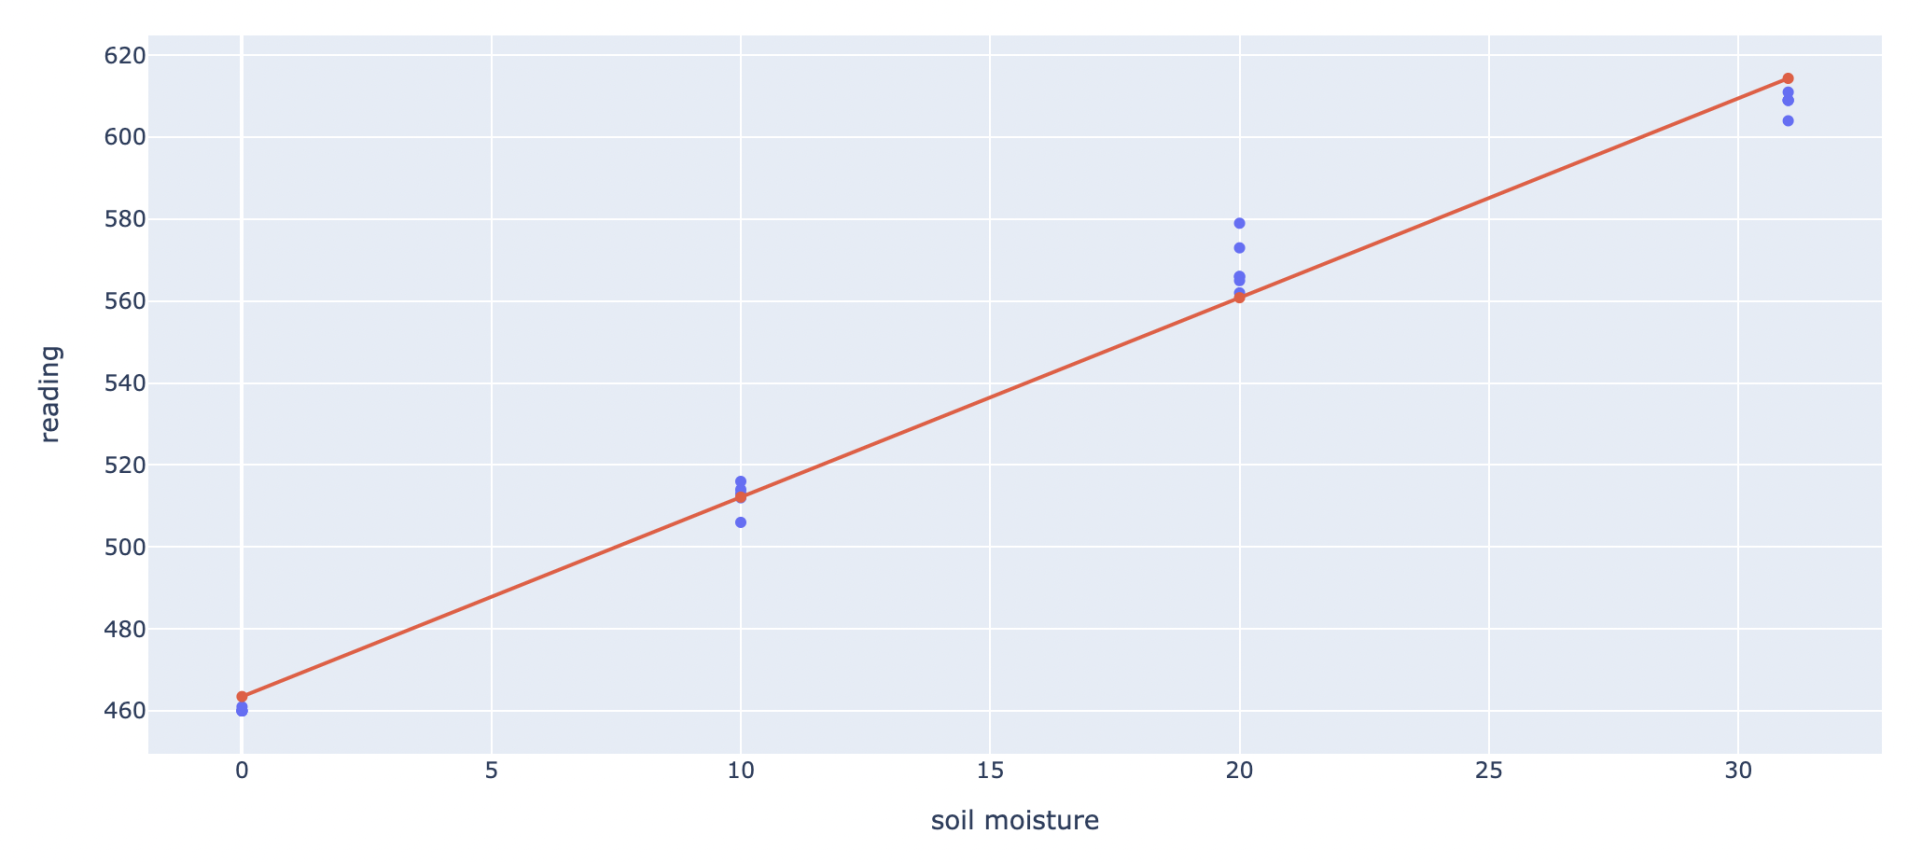
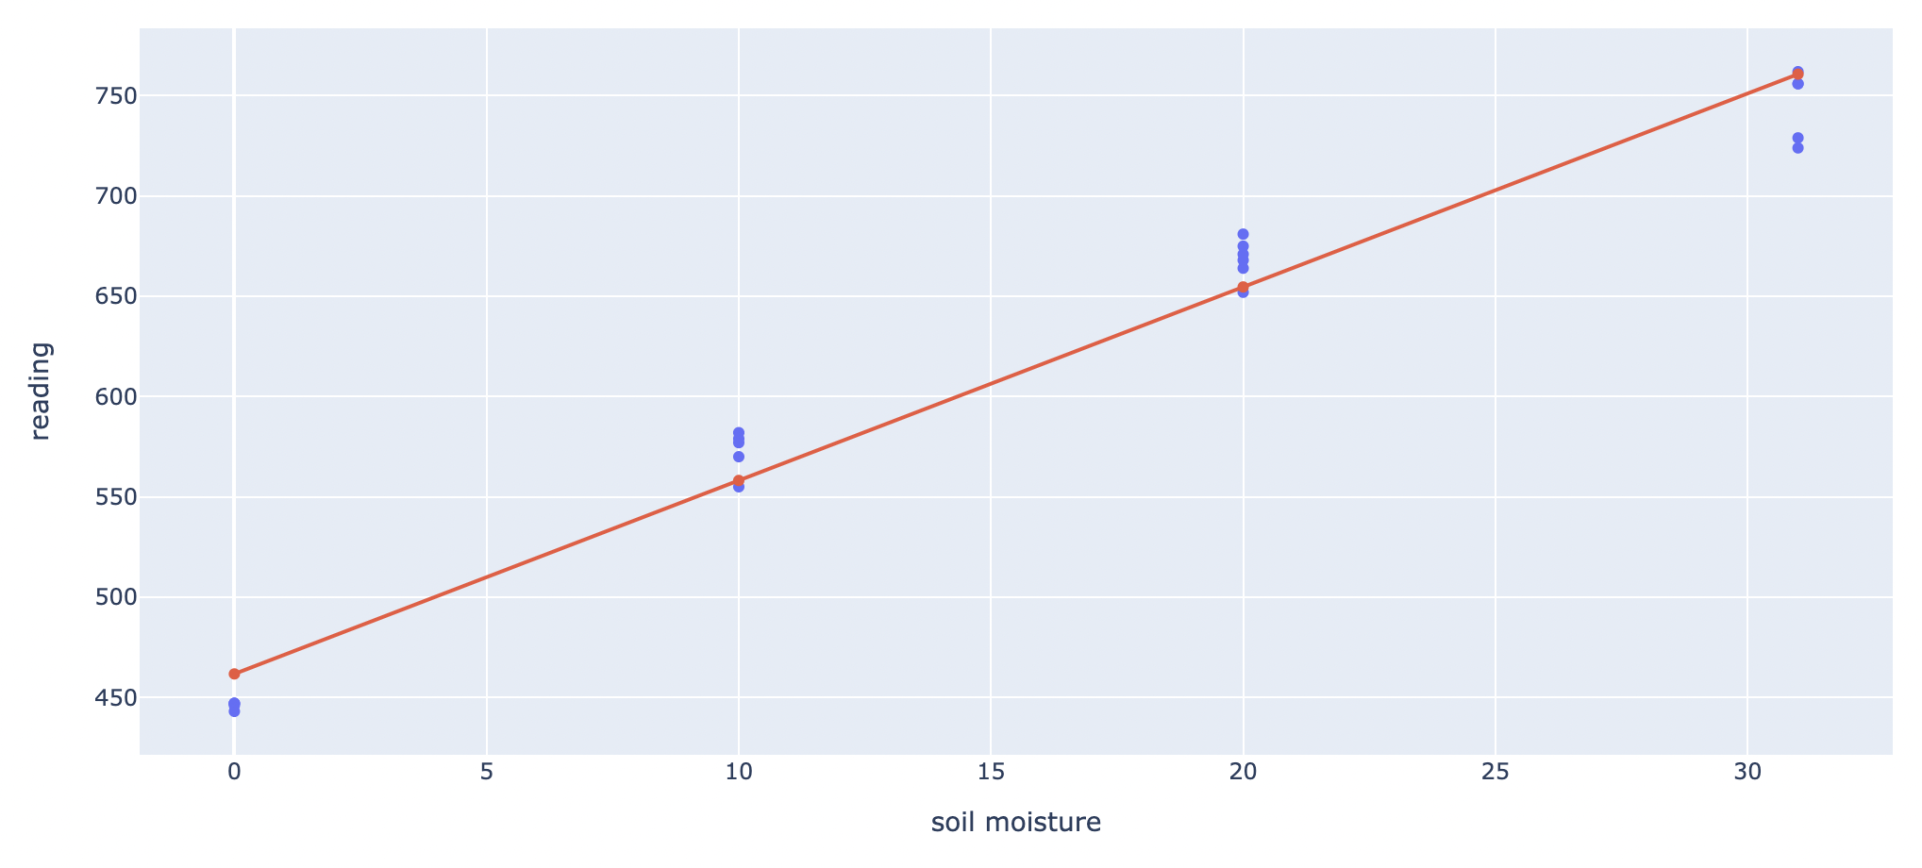
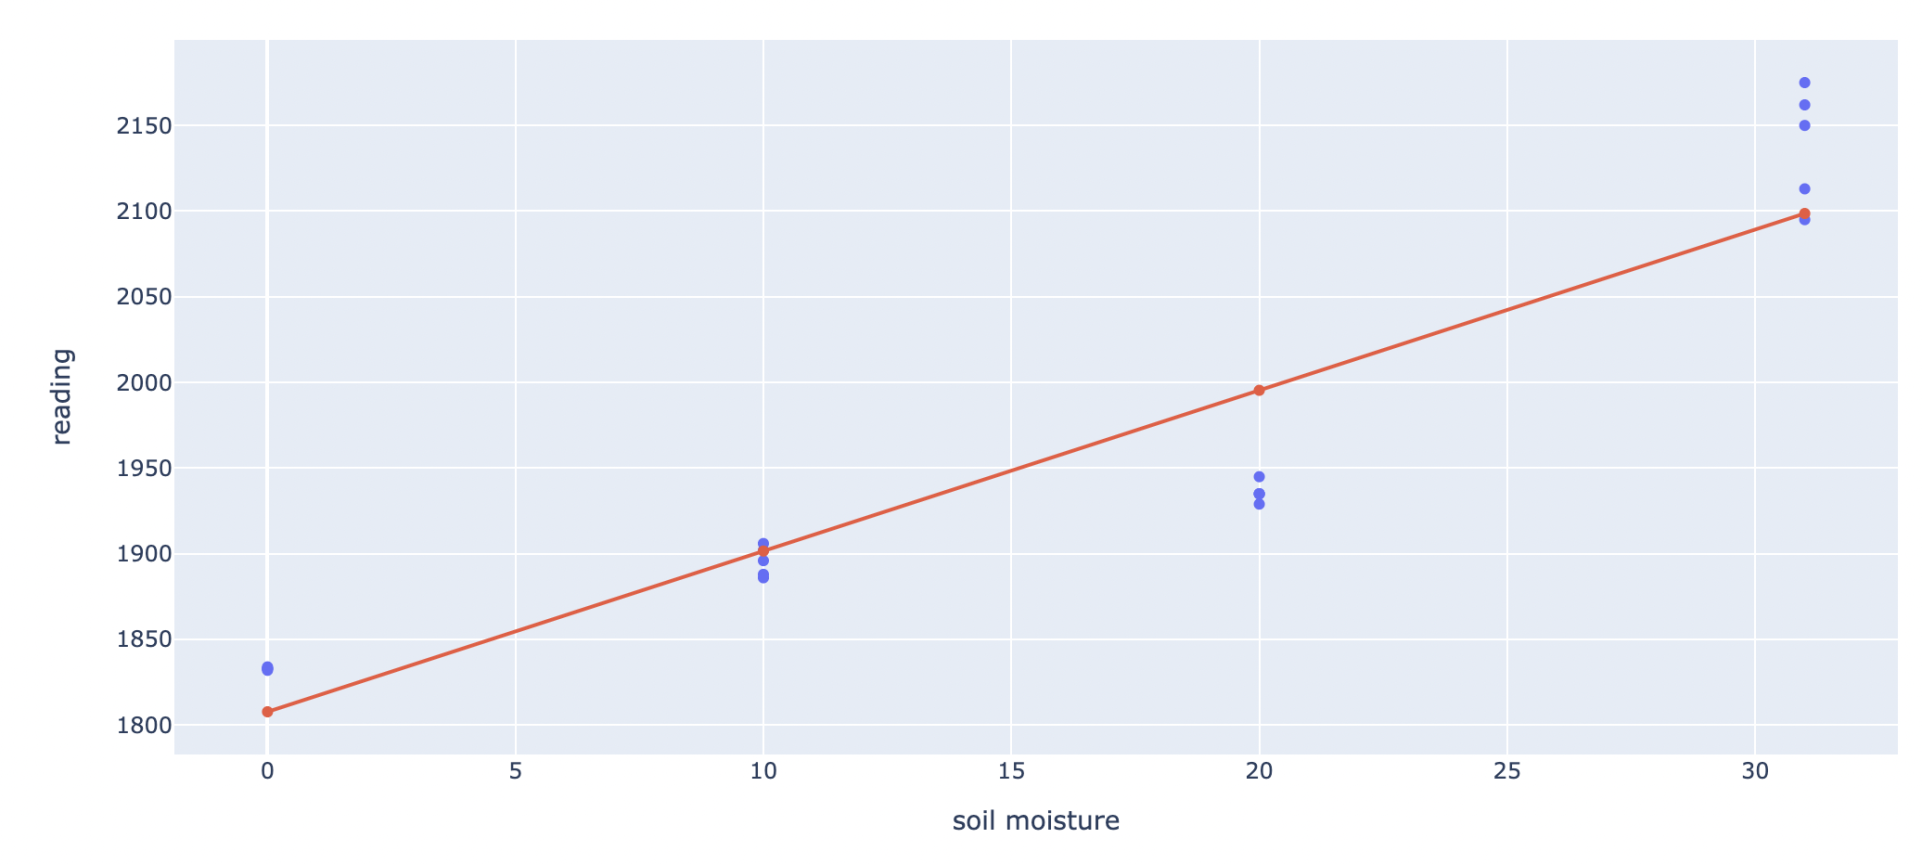
1. Plot the data for each probe individually. Plot the sensor value on the X axis and the soil standard % moisture on the Y axis.
2. Fit a regression line to the data.
3. Calculate the Pearson Correlation Coefficient.
4. Calculate the % moisture predictions from the coefficients of the regression line (e.g., slope x sensor reading + intercept).
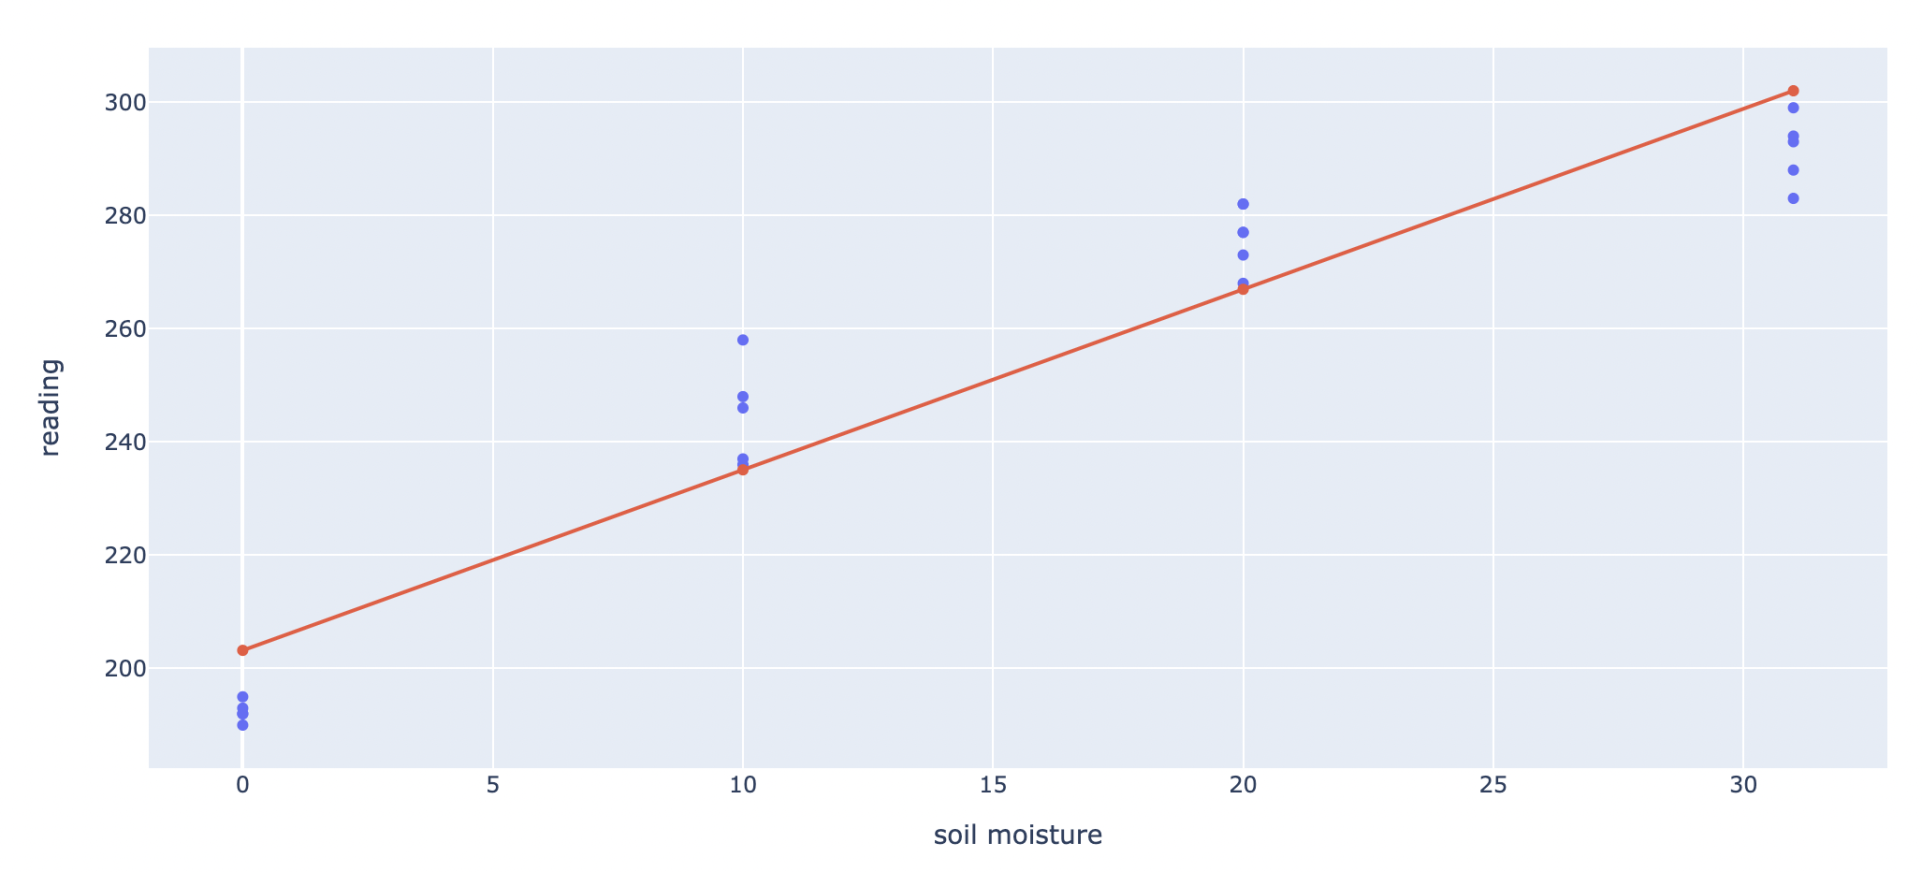
5. Calculate the standard error of the estimate using the following equation
where Y is the true % moisture, Y' is the predicted % moisture and N is the degrees of freedom or number of samples minus 2 because both the slope and intercept are used in the predictions. 6. Calculate the 95% Confidence Interval for a two-tailed distribution by CI_95 = 2 x 1.96 x σ.
Results
Linearity
Linearity is convenient for converting a signal to more universal units. In this case, we want to know how sensor signals relate to soil moisture %. Results for linearity from best to worst: Leaflet (R=0.993), EC-5 (R=0.987), Chirp! (R=0.952), and TEROS 12 (R=0.934, this one does not look good!). Leaflet may still benefit from a curvilinear model to calculate moisture %, and we will explore this down the road.
Precision
We measured accuracy two ways. Because the leaflet has the best linearity, results from the two methods agree well.
First, we used the coefficients of the regression line to obtain soil moisture predictions. We then calculated the error from the residuals of the fit using equations above. Results: Leaflet 5.4% error, EC-5 7.7% error, Chirp! 15.0% error, and TEROS 12 18.2% error.
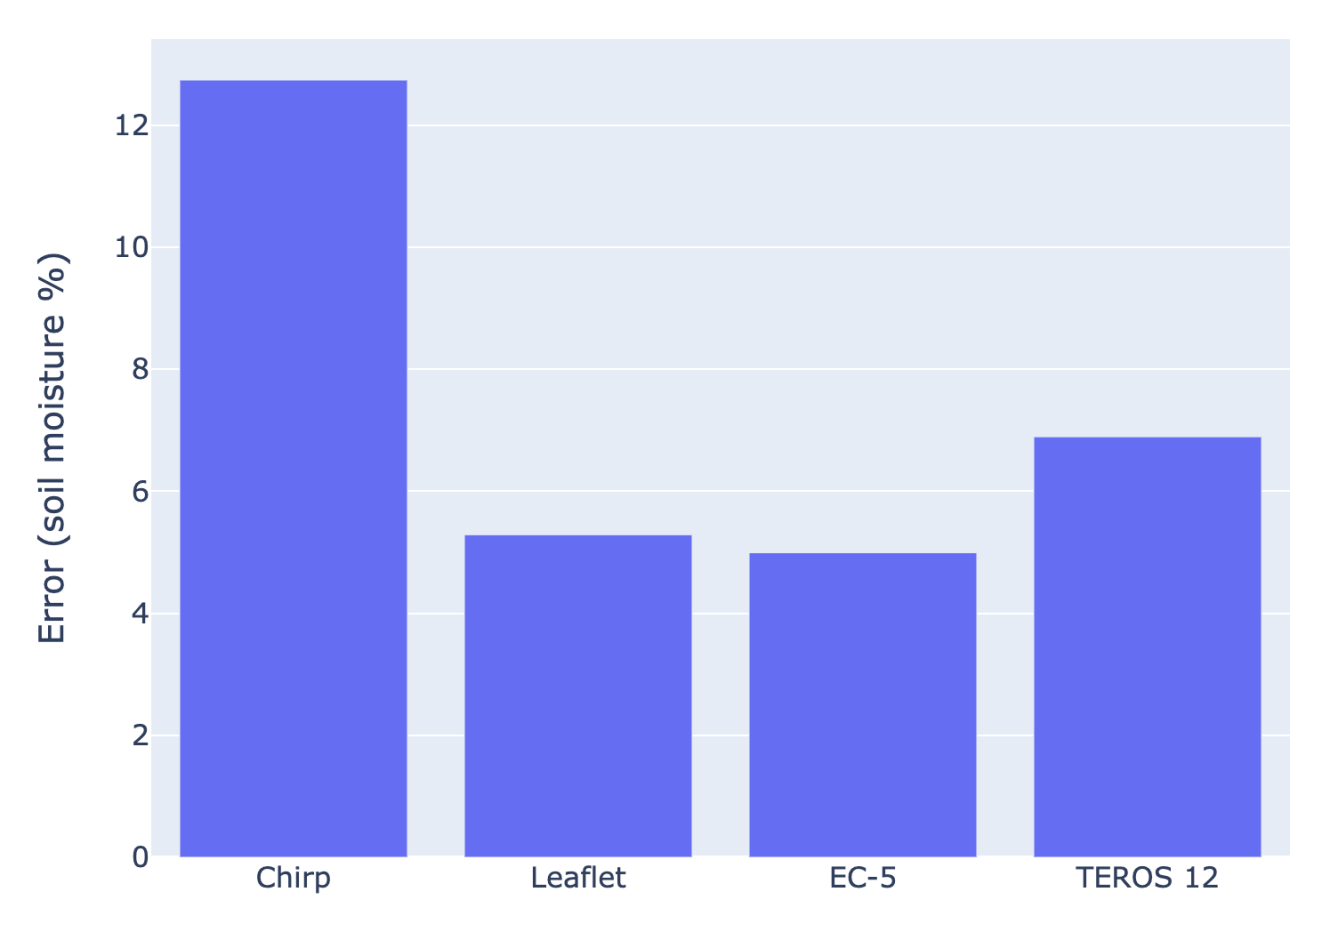
Second, We repeated 21 measurements in 20% soil. Then We calculated the error based on those measurements (again from above, i.e. CI_95 = 2 x 1.96 x σ where σ is the standard deviation). Results: EC-5 4.9% error, Leaflet 5.2% error, TEROS 12 6.7% error, Chirp! 12.4% error.
Here is nice visual of the results from the second method (the method we prefer).
Conclusion
Our sensor performs as well as commercial, agricultural-grade sensors and significantly better than standard sensors.
Side Note: We used the Chirp! in our alpha sensors. We are excited for the giant boost in performance we are getting with the Leaflet!


